News from the Underground

Another week, another batch of highlights from the world of Software Underground.

Before we get to the nuggets from Slack, there have been a few changes to the website. The front page is new, and there’s a new page explaining why Slack is so cool, in the hope that more people sign up and take part in those conversations. There’s also a new page for potential sponsors, and you can now register for TRANSFORM virtual conference — or buy a T-shirt!

You don’t have to wait for TRANSFORM to hear about subsurface geophysics. There are two Subsurface Rendezvous events coming up in February — from Sean Walker and Matteo Ravasi — read all about them on the website. Both promise to be unmissable… and they’re free!

As usual, the Slack chat has also been active; here are some highlights:

Entwine – A posting about a USGS service for viewing and analyzing lidar datasets in your browser caught my attention. It’s always fun when you can click on a link and immediately start playing around.

Look at all those buttons!

Look at all those buttons!

Plan for redundancy. There was a post about the Women in Geothermal (WING) organization this last week. Their vision is short and brilliant and worth repeating: “The aim is to one day become redundant, where no group needs to advocate for gender equality.”

Can you see my faults? Elwyn Galloway posted about a Voila app that makes a forward model of a normal fault. Go and slide the sliders. Apps like this are fun to see — interactive, single purpose, on the web, shareable. And built entirely using open source code, with attribution.

elwyn_fault_slider.png

Yet another visualization library for Jupyter? Yes! If you’re looking to make interactive 3D visualizations in Python you’ve got load of tools to choose from: PyVista, IPywidgets, Bokeh, IPyVolume, and more (info and links at PyViz.org). There’s new one to check out called ipygany with all sorts of cool features made awesomer by using your GPU.

As usual, if I missed something cool, let us know in the comments. And if you spot anything hot in the coming week, drop tips in the comments or in Slack.

News from the Underground

Welcome to the news post! Here’s what’s hot this week in the Underground.

Just in time help — One of the hallmarks of the Underground is fast help with digital workflows. It easily beats Google for those occasions when you’re not even sure what to search for. On Monday, Mads asked how to get a horizon slice through a 3D seismic volume. Within minutes he had suggestions using the awesome segysak tool, or just xarray on its own, or pure SciPy.

How does your river flow? — Got an elevation model but it’s too low resolution for your watershed model? There were lots of good recommendations for software that may be helpful here. And don’t forget about the glorious geospatial tool that is QGIS — free and open source.

Unfolded Studio – Not to be confused with a room where structural geologists do palinspastic reconstruction, Justin Gosses posted a link to this new project from the folks at Uber who built kepler. If you’re into geospatial analytics, you need to see this, it looks beautiful.

unfolded.jpg

The maestro of the meandering – Zoltan Sylvester’s 3D stratigraphic displays got a mention in the #viz channel. It’s worth checking out the README to his repo, it has plenty of the fluvial stratigraphic eye candy you’d expect from Zoltan.

Sedimentary logs as data — Sometimes data is locked away in Adobe Illustrator drawings. John Armitage asked about converting a pile of drawings of sedimentary logs into structured data, and got lots of suggestions. He eventually got striplog to work on most of the data. The power of Swung!

Contests and openness – Bobbing in the wake of the SPE contest we mentioned last week, Matt wrote an open letter to TGS about the licensing of the data and there was some chat about it on Slack. If you care about data science contests, community engagement, and how to maximize innovation and impact, give the post a read.

See anything else in the channels I may have missed? Leave a note in the comments.

News from the Underground

Hello! Welcome to the first of a series of (hopefully) regular round-ups and highlights from what’s happening in the Software Underground. We’ll cover announcements and cool events, plus anything we think is relevant, popular, or just cool.

The heart of the Software Underground is the Slack workspace. It’s so busy these days that it’s hard to catch everything, so we hope this round-up helps. True to the nature of geoscience, our selection criteria will be a mix of quantitative and qualitative. And as scientists, we’ll allow ourselves the freedom to improve our methods over time. Disagree with something? Tell us about it.

We’ve put links here that will take you directly to the messages in Slack. Just keep in mind that you’ll have to be logged into your account for those to work. If you’re not a member yet, sign up here — it’s free.

slack_logo.png

SPE Data Analytics wireline log contest – An announcement was made about this new competition. The entrance fee, though small, was an initial surprise to some, but apparently the revenue will go toward SPE student scholarships. Another conversation surfaced on how tricky it is to evaluate the submissions in relatively niche contests such as these. The contest launches today, 15 January.

Jupyter Notebooks in Excel – Apparently there are two types of people in the subsurface world: those who use Excel, and those who are in Software Underground. LOL. Seriously though, a link about embedding Jupyter notebooks in Excel brought a mixture shock and horror.

Anaconda Navigator != conda – Confused about what Anaconda Navigator brings to the table? So are others in the community! Many of us prefer the command-line conda tool, but that comes with its own challenges, as discussed in this thread on teaching about environments. Do you use Navigator? Do you like it? Let us know what you think in the comments.

Connecting the dots Creating linestrings from collection X and Y coordinates is straightforward if you know the sequence in which the dots are connected. If the points aren’t ordered, then the problem is more difficult. Some good discussions were bolstered by Leo Uieda’s gentle nudge, “We’d love to have this sort of thing in Verde if you’re keen on contributing.”

Wherefore art thou open data? The need for open data came out of a member testing a seismic well-tie algorithm. Several folks pointed him toward a number of open data sets. A number of the usual suspects that come up again and again are: SEG wiki, F3, UK Oil and Gas Authority, and the Data Underground. The Data Underground is a Swung project, so you should definitely poke around and let us know what else might live there. Open Data. Yes please. Let’s have some more of that.


The quality and speed of the knowledge sharing in the Software Underground is truly remarkable. Whether you’re asking questions, responding to others, or just sharing something that’s cool, we are all bettered by it. See you in Slack!

Tech for online meetings

Tech for online meetings

In pulling TRANSFORM 2020 together, the organizers (Filippo Broggini, Brendon Hall, Rob LEckenby, Victoria-Lou Devezes, and me) looked at a lot of technology options. I thought I’d share the stuff we used here, in case you’re wondering what you need for a full-on virtual conference. But first, I’ll try to give a high-level description of the sorts of events we hosted at the conference.


We had three main types of session to support:

Tutorials

We hosted 14 three-hour tutorials, which mostly involved one or two instructors and 10 to 150 learners. Behind the scenes, there was one ‘livestream host’, who was essentially like a TV director.

The instructors were in a Zoom meeting with the host, sharing screens with them. The host captured their Zoom meeting with OBS Studio, and streamed it to YouTube Live. All of the participants watched via YouTube, and the live stream is also preserved there.

Lightning talks

There were two lightning talk sessions, each two hours long. The set-up was similar to the tutorials, except that there were more presenters — 12 per session. They came into the Zoom just before their allotted time and left right after, so there were never more than 3 or 4 people in the Zoom at once.

Unsessions

These were not streamed to YouTube, so we were able to host everyone in one big Zoom meeting. (I had a Large Meeting add-on ‘just in case’ but we didn’t need it in the end; the most we had was 97 people.) This made the session susceptible to Zoom-bombing, so we were careful about where we shared the link, and we used a waiting room — with Victoria ‘on the door’ to let people in promptly.

The unsession format, which I’ll write about another time, relied heavily on Zoom’s breakout rooms. We also used GroupMap a lot — it’s a great tool for capturing ideas from a group of people.


Here are the tools we used:

  • Slack — the heart and mind of the Software Underground already lives in our Slack workspace. To make the multiple conversations more manageable, we made channels for all of the sessions and hackathon projects, and this worked well. During the week, 700 active members exchanged about 19,000 messages, about 50% of which were in private chat.

  • Zoom — the Covid-famous video conferencing tool. It worked well for us for the host–presenter meetings in the tutorials and lightning talks, and as the main room for the unsessions and hackathon presentations. We were very worried about Zoom-bombing, and were perhaps over-cautious (some legit people found it hard to enter sessions).

  • YouTube — for the tutorials and lightning talks, we streamed the host–presenter Zoom to YouTube for participants to consume. This has a few big advantages: it eliminates the Zoom-bombing risk, participants can pause and rewind the live stream, and videos go straight to YouTube afterwards. And it’s free!

  • OBS Studio — a fantastic open-source tool that lets you combine images, video feeds, and audio sources into a single stream, which you can send to YouTube (or Twitch or any other streaming service). This is how we streamed the Zoom sessions. It does have a learning curve though, and certainly requires an off-screen ‘director’ to manage it all — and several practice sessions to get the workflow down.

  • GitHub — is indispensable for code-sharing and source control. I think all of the hackathon projects hosted their repos on GitHub. The tool is not intuitive for new programmers though, and wrangling git and GitHub is one of the most requested help topics in our hackathons and courses.

  • GroupMap — a wonderful tool for collaborative brainstorming. It definitely needs a couple of hours to get the hang of what it can do, but for me this was the standout discovery of the event. Its best feature is that you can set up a workflow, like Survey > Brainstorm > Vote > Results and then guide the group through the stages, live.

  • Sched and Eventbrite — for event registration. Both of these tools have their high-points — Sched is really nice for building the event schedule — but the registration process for the event was a bit of a hairball and while these tools are supposed to play nicely together, I never felt comfortable with either of them.

  • Printful — a T-shirt (and other merch) vendor. The advantages are that they print ‘direct to garment’ (i.e. there’s no setup, they just print a shirt when you order one), they take care of fulfilment, and their system works seamlessly (sort of) with Squarespace, our website host. But the system is not that easy to use and I’m thinking of switching to Teespring.

  • We also used a bit of hardware. Microphones were hard to find during the Covid-19 crisis, but we sent Blue Yeti Nano or Blue Snowball Ice USB mics to our instructors. The Yeti Nano is especially nice, with two pickup patterns and a hardware mute button.

  • Other… The organizers and the participants used other tools during the conference, including: Mentimeter, Google Maps, Miro, and HackMD, plus of course Twitter and other social media.


I don’t think I appreciated it before the event — looking back, it seems obvious — but technology is completely intertwined with an online-first event. Sometimes the limitations of the tool force you to adapt; other times, the tool can enable new things you hadn’t thought of. It’s going to be interesting watching these remote collaboration tools evolve over the coming months and years. And even more interesting thinking about what kinds of meetings we can have with them!

If you have a favourite collaboration tool I haven’t mentioned here, or you’ve been in a meeting that did something different, I’d love to hear about it.

The TRANSFORM 2020 hackathon, Part 2

The TRANSFORM 2020 hackathon, Part 2

This is part 2 of a pair of posts about the TRANSFORM 2020 Hackathon. Read part 1 here.

Welcome back to the TRANSFORM 2020 Hackathon project round-up!

Last time we shared six projects; the remaining projects are listed below. As before, to find out more about a project, get in touch with its champion, or visit its channel, in the Software Underground Slack. The channels all start with #t20- so, for example, the GemGIS channel is #t20-gemgis.


Seismic processing

Alan Richardson set himself the ambitious task of wrapping CPSeis, an open source seismic processing system, in Python. However, this proved fiddly, so he set himself the even more ambitious task — albeit one with fewer dependencies — of writing a seismic processing system in Python. Punchline: he’s building it with TorchScript. It’s going to be epic. Repo.

seis_pro_both.png

Covid-19

Artash Nath, a talented 8th grader from Toronto, led a project to observe the impact of COVID-19 lockdown restricitons on the traffic movement in several Canadian cities. Specifically, Artash’s goal was to measure the change in the seismic vibrations in major cities before, during, and after their lockdown period. Repo.

signals-of-silence.png

GemGIS

Alexander Juestel and Arthur Endlein attempted to meld the worlds of GIS and GemPy. Their goal was to build a 3D geological model from a geological map (a shapefile) and a DEM (a raster). The process was fully interactive, so they could digitize a cross-section right in a notebook. Repo.

gemgis_example_screenshot.png

Geothermal field

Alexis Lamparski and Elisa Heim, along with a few others, analyzed and visualized seasonal upper soil temperatures over a geothermal field. Their goal was to find a correlation with fluid temperature differences inside the horizontal pipes connecting borehole heat exchangers to the heat pump. Repo.

geothermal-fields.png

Litho-boundary from gamma

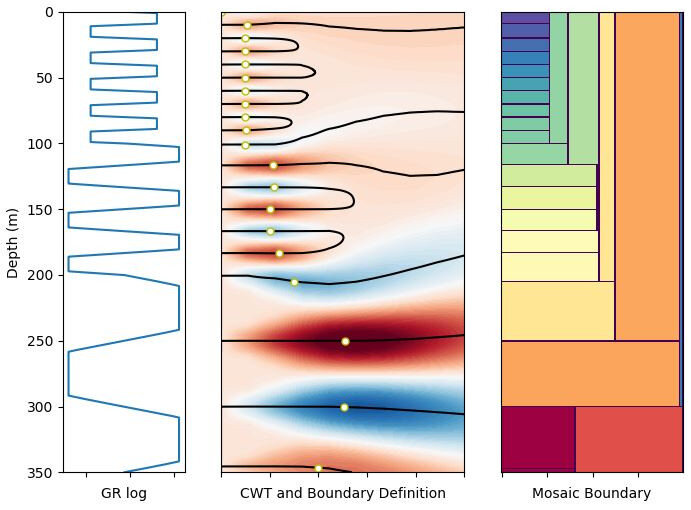
Jared Armstrong, after reading a recent paper about generating lithological boundaries from gamma using wavelet tessellations, Jared decided to stay up late and join from Down Under. Jared joined forces with Leo C and Martin Bentley and together they were able to create promising initial results. Repo.

GR_boundary_test_on_synthetic_data.jpeg

Devito

Gerard Gorman and Fabio Luporini, together with other project developers, took advantage of the hackathon to improve the documentation and to start tackling issues related to HPC and distributed computing for the Devito geophysical modeling project.


Space rocks

Hunter Danque took a shot at the Moon… using the lunar GPR data from China's Yutu 2 rover. Hunter started working towards his goal to load the data to eventually extract geotechnical properties for future lunar site investigations. Repo.


This amazing event was the first big virtual hackathon we’ve taken on. With at least 60 people collaborating on 13 projects, it was undoubtedly a success, but we learned a few things too. It was less accessible to new programmers than our live events usually are. And it was hard to even begin to approximate some of the social aspects of a live hackathon.

One thing is certain: we will be doing this again — and you’re invited. See you then!


Many thanks to our sponsors for their generous support of this event

sponsors_letterbox.png