Here are some highlights from the Software Underground Slack this week.
Increasing dtype diversity — Progress is being made within NumPy to handle more diverse datatypes which would allow for ndarrays to carry information about units and other things. There’s been lots of other chat in the #python channel this week; check it out.
Micro-editors wanted — The collaborative book project, 52 Things You Should Know About Geocomputing has amassed the requisite number of articles and is undergoing review. And what better way to edit a collection of essays than with a collection of editors? The articles are less than 800 words and cover a very wide range of topics. So if you’re interested in helping with the review, pop into the #52things channel and say hello.
Quantitative blobology? — One question this week spurred a lot of discussion about how to do more quantitative things with amplitude maps. The thread brings up uncertainty, subjectivity, and information theory. Threads like this are always a goldmine of insight and information, check it out.
Choosing open licences — A discussion on open licences for content, code and data brought out some useful links, and led to Matt writing a blog post about choosing licences for open science.
Digital rocks — One of the great challenges of subsurface science and engineering is that we usually cannot directly measure the thing we are interested in. Interested in lithology down a borehole? You can count gamma rays. Want to know the amount of pore space? Scatter some neutrons or bounce some sonic pulses around. Check out this thread discussing synthetic forward modeling and inversion of petrophysical data, and pointing at GebPy (pictured here), an interesting new tool for petrophysics.
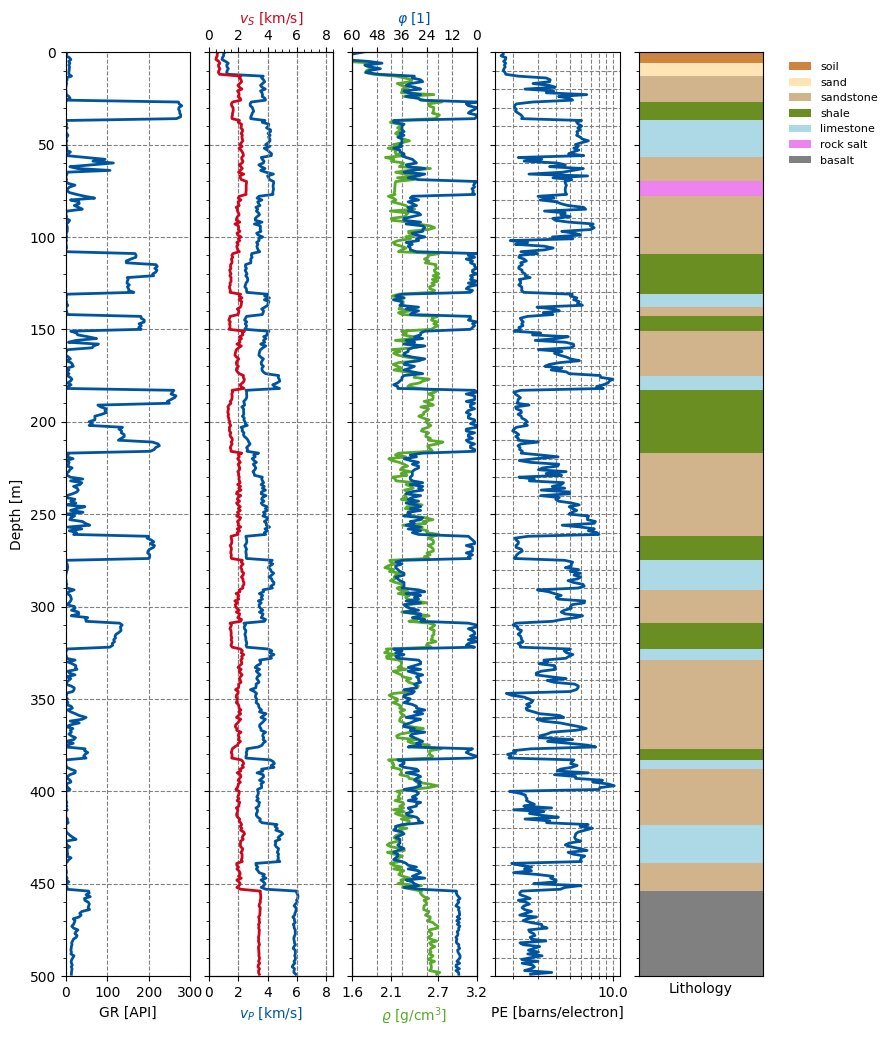
GebPy, as pictured in Maximillian Beeskow’s Twitter post.
That’s it for this week, what did I miss?


