Viewing entries tagged
open data

News from the Underground

News from the Underground

In the seemingly random content factory that is the Software Underground community, there has been a heavy sampling this past week around openness. What is open source? What is open data? What are good practices? and, How does this affect me? Here’s a collection of those conversations and more.

The Geothermal Hackathon — happened last week immediately following the World Geothermal Congress Geoscience virtual event. You can read about the things that people built leveraging open data sets and be sure to connect with these creators in the #geothermal channel.

The complicated world of open source — Spilling over from an SPE workshop on Open Software, is perhaps the longest thread in Swung history about what actually constitutes open source software, why it can be so confusing, and what the implications are for scientists and technologists. Matt followed up with a number of suggestions how technical societies can support openness, and also created a poll to measure the degree of confusion around open source. Conclusion: it depends.

A checklist for open scientific software — Yes, open source is complicated, especially for newcomers, so it seems fit for relatively straightforward tools to guide behaviours. Matt shared a so-called best-practice checklist for open scientific software, which quickly underwent a handful of revisions after some supportive feedback. It is meant to be more than just tick marks on a piece of paper but that it can be a vehicle for delivering behavioural change.

open_source_checklist_ripped_banner.png

Big Borehole Dig – Steph shared a cool project launched by the British Geologic survey welcoming scientists and citizen scientists alike to digitize their vast collection of historic logs into a standard digital format. It’s the ‘ol PDF to actually-digital transformation challenge and this one is a tall order. But just imagine the data science possibilities from 1.4 M boreholes!

Tools and tactics – people are getting help on to tricky technical questions in the #python channel on a variety of topics including: dealing with very large tabular data with Vaex, how to constrain solutions to non-linear problems with scipy.optimize, and fixing missing data values in rasters with rasterio.

Vedo – in the visualization awesomness category, the winner goes to a post that Dieter made in the #viz channel about the Vedo project, whose gallery will incite all the feels of a kid in candy store for those working in 3D. Notably, the first tile in the gallery is a demo geo-model shared by Richard Scott. Check out his scene here before you get on with the rest of your day.

Vedo – a python module for scientific analysis and visualization of 3D objects.

Vedo – a python module for scientific analysis and visualization of 3D objects.

News from the Underground

Here are some highlights from the Software Underground Slack this week.

Increasing dtype diversity — Progress is being made within NumPy to handle more diverse datatypes which would allow for ndarrays to carry information about units and other things. There’s been lots of other chat in the #python channel this week; check it out.

Micro-editors wanted — The collaborative book project, 52 Things You Should Know About Geocomputing has amassed the requisite number of articles and is undergoing review. And what better way to edit a collection of essays than with a collection of editors? The articles are less than 800 words and cover a very wide range of topics. So if you’re interested in helping with the review, pop into the #52things channel and say hello.

Quantitative blobology? — One question this week spurred a lot of discussion about how to do more quantitative things with amplitude maps. The thread brings up uncertainty, subjectivity, and information theory. Threads like this are always a goldmine of insight and information, check it out.

Choosing open licencesA discussion on open licences for content, code and data brought out some useful links, and led to Matt writing a blog post about choosing licences for open science.

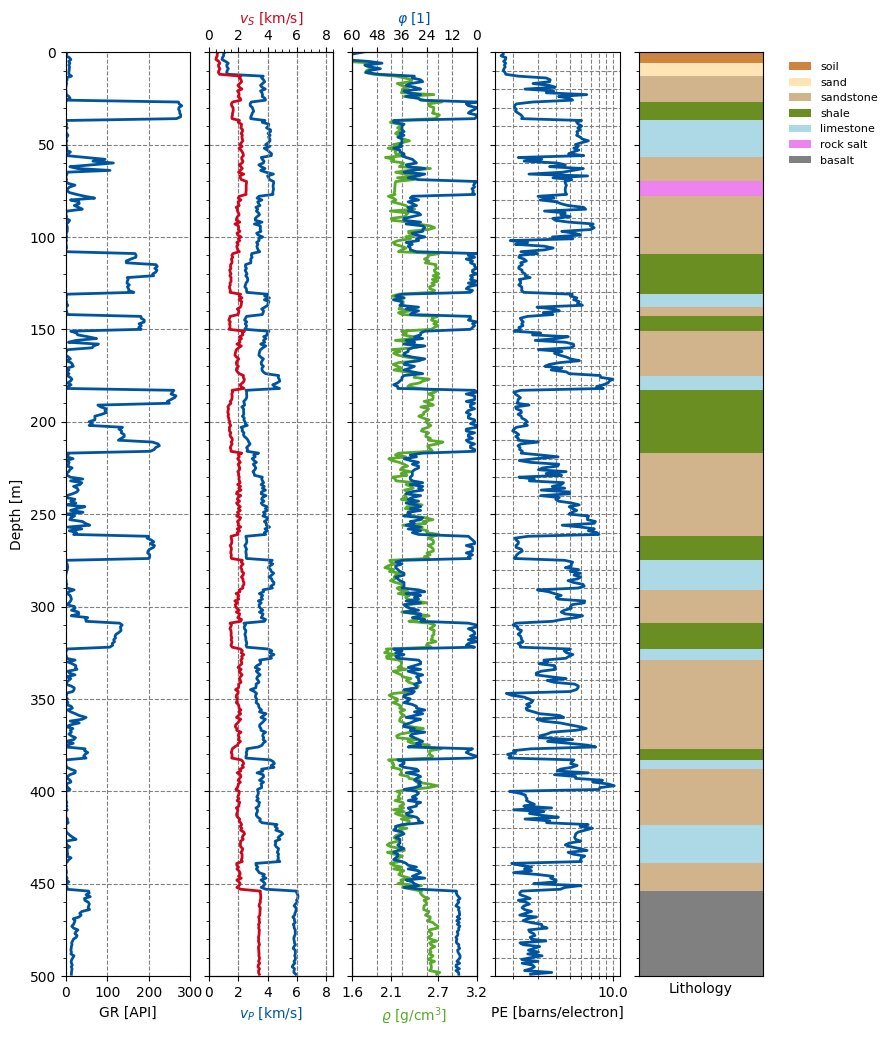
Digital rocks — One of the great challenges of subsurface science and engineering is that we usually cannot directly measure the thing we are interested in. Interested in lithology down a borehole? You can count gamma rays. Want to know the amount of pore space? Scatter some neutrons or bounce some sonic pulses around. Check out this thread discussing synthetic forward modeling and inversion of petrophysical data, and pointing at GebPy (pictured here), an interesting new tool for petrophysics.

 
GebPy, as pictured in Maximillian Beeskow’s Twitter post.

GebPy, as pictured in Maximillian Beeskow’s Twitter post.


That’s it for this week, what did I miss?

News from the Underground

News from the Underground

Before jumping into the highlights from the Slack channels, just a reminder that the schedule is lining up for TRANSFORM 2021 conference in April. Go to the event page and register now!

Colour by numbers — There is a bit of art and a bit of science involved in making data visualizations — but it’s mostly science. For instance, this thread is an absolute showcase of pure helpfulness and enthusiasm about colouring a 2D array of numbers. Not always as easy as it sounds…

Harty_ripples.png

Scraping open the earthA post about Pangaea, a data publishing service dealing with a variety of datasets in the earth and atmospheric sciences. Oh, and wanna loop through thousands of geospatial datasets in the inventory, Wesley’s got you covered.

Coordinate system correctness — Need to fix an erroneous coordinate reference system (CRS) in a shapefile? GeoPandas has got what you need.

Confused about type hints in Python? You’re not alone. There was a massive conversation about it this week on Swung. Conclusion: Yes.

Open all the wells — How many signatures will it take to open an entire country’s well data? No idea, but we might get to find out. A post was shared about a petition to the Dutch government to open all the well logs in the Netherlands. The petition, originating with one of the dGB founders, is still open.

Five star open data — Still on open data, is the post pointing to Sir Tim Berners-Lee’s Five Star Open Data plan. Some other frameworks, models, and concepts were discussed in this thread. What should Swung be doing to adopt, modify, or accelerate these initiatives?

What caught your eye on Software Underground this week? Let us know in the comments.

News from the Underground

Welcome to the news post! Here’s what’s hot this week in the Underground.

Just in time help — One of the hallmarks of the Underground is fast help with digital workflows. It easily beats Google for those occasions when you’re not even sure what to search for. On Monday, Mads asked how to get a horizon slice through a 3D seismic volume. Within minutes he had suggestions using the awesome segysak tool, or just xarray on its own, or pure SciPy.

How does your river flow? — Got an elevation model but it’s too low resolution for your watershed model? There were lots of good recommendations for software that may be helpful here. And don’t forget about the glorious geospatial tool that is QGIS — free and open source.

Unfolded Studio – Not to be confused with a room where structural geologists do palinspastic reconstruction, Justin Gosses posted a link to this new project from the folks at Uber who built kepler. If you’re into geospatial analytics, you need to see this, it looks beautiful.

unfolded.jpg

The maestro of the meandering – Zoltan Sylvester’s 3D stratigraphic displays got a mention in the #viz channel. It’s worth checking out the README to his repo, it has plenty of the fluvial stratigraphic eye candy you’d expect from Zoltan.

Sedimentary logs as data — Sometimes data is locked away in Adobe Illustrator drawings. John Armitage asked about converting a pile of drawings of sedimentary logs into structured data, and got lots of suggestions. He eventually got striplog to work on most of the data. The power of Swung!

Contests and openness – Bobbing in the wake of the SPE contest we mentioned last week, Matt wrote an open letter to TGS about the licensing of the data and there was some chat about it on Slack. If you care about data science contests, community engagement, and how to maximize innovation and impact, give the post a read.

See anything else in the channels I may have missed? Leave a note in the comments.

News from the Underground

Hello! Welcome to the first of a series of (hopefully) regular round-ups and highlights from what’s happening in the Software Underground. We’ll cover announcements and cool events, plus anything we think is relevant, popular, or just cool.

The heart of the Software Underground is the Slack workspace. It’s so busy these days that it’s hard to catch everything, so we hope this round-up helps. True to the nature of geoscience, our selection criteria will be a mix of quantitative and qualitative. And as scientists, we’ll allow ourselves the freedom to improve our methods over time. Disagree with something? Tell us about it.

We’ve put links here that will take you directly to the messages in Slack. Just keep in mind that you’ll have to be logged into your account for those to work. If you’re not a member yet, sign up here — it’s free.

slack_logo.png

SPE Data Analytics wireline log contest – An announcement was made about this new competition. The entrance fee, though small, was an initial surprise to some, but apparently the revenue will go toward SPE student scholarships. Another conversation surfaced on how tricky it is to evaluate the submissions in relatively niche contests such as these. The contest launches today, 15 January.

Jupyter Notebooks in Excel – Apparently there are two types of people in the subsurface world: those who use Excel, and those who are in Software Underground. LOL. Seriously though, a link about embedding Jupyter notebooks in Excel brought a mixture shock and horror.

Anaconda Navigator != conda – Confused about what Anaconda Navigator brings to the table? So are others in the community! Many of us prefer the command-line conda tool, but that comes with its own challenges, as discussed in this thread on teaching about environments. Do you use Navigator? Do you like it? Let us know what you think in the comments.

Connecting the dots Creating linestrings from collection X and Y coordinates is straightforward if you know the sequence in which the dots are connected. If the points aren’t ordered, then the problem is more difficult. Some good discussions were bolstered by Leo Uieda’s gentle nudge, “We’d love to have this sort of thing in Verde if you’re keen on contributing.”

Wherefore art thou open data? The need for open data came out of a member testing a seismic well-tie algorithm. Several folks pointed him toward a number of open data sets. A number of the usual suspects that come up again and again are: SEG wiki, F3, UK Oil and Gas Authority, and the Data Underground. The Data Underground is a Swung project, so you should definitely poke around and let us know what else might live there. Open Data. Yes please. Let’s have some more of that.


The quality and speed of the knowledge sharing in the Software Underground is truly remarkable. Whether you’re asking questions, responding to others, or just sharing something that’s cool, we are all bettered by it. See you in Slack!